Are you tired of spending hours on end trying tomanage your project workflow? Look no further than JIRA Cycle Time. But to truly unlock its potential, consider partnering it with Keypup, a platform designed to monitor, analyze and streamline your software development process.
Whether you're a small start-up or a large enterprise, JIRA Cycle Time, combined with Keypup's Cycle Time products, offers the perfect solution for streamlining your processes and getting tasks completed faster. By assessing the time it takes for an issue to move through your workflow, Cycle Time analysis provides valuable insights into areas for improvement, allowing you to identify bottlenecks and optimize your team's performance.
Understanding the Concept of Cycle Time : The Cornerstone of Efficiency
In the world of project management, cycle time is a crucial metric that measures the time it takes for a task or issue to move through the entire workflow, from the initial request to its final completion. This encompasses the time spent on various stages such as planning, development, testing, and deployment. Understanding the concept of cycle time is essential for organizations that want to streamline their processes, improve efficiency, and deliver projects more quickly.
Cycle time is different from lead time (bug lead time, Issue lead time or Pull Request lead time), which measures the total time from the initial request to the final delivery of the product or service. While lead time is a more comprehensive metric, cycle time focuses specifically on the time spent actively working on a task or issue within the workflow. By analyzing cycle time, organizations can identify bottlenecks, optimize resource allocation, and make data-driven decisions to enhance their overall productivity.
Tracking and analyzing cycle time can provide valuable insights into the health of an organization's workflows, enabling teams to identify areas for improvement, streamline processes, and ultimately deliver better results for their clients or customers. By understanding the concept of cycle time, organizations can unlock the power of data-driven decision-making and drive continuous improvement in their operations.
Importance of Cycle Time in Improving Efficiency and Productivity
Improving efficiency and productivity is a top priority for organizations across industries. In today's fast-paced business environment, the ability to complete tasks and deliver projects quickly and effectively can be a significant competitive advantage. This is where the concept of cycle time comes into play.
By measuring and analyzing cycle time with comprehensive tools, organizations can gain a deeper understanding of their workflow and identify opportunities for optimization. Shorter cycle times often indicate a more efficient and streamlined process, while longer cycle times may point to bottlenecks or areas that require attention. By addressing these issues, organizations can unlock significant gains in productivity and efficiency.
One of the key benefits of focusing on cycle time is the ability to identify and eliminate waste within the workflow. This can include unnecessary delays, duplicated efforts, or inefficient communication channels. By addressing these pain points, organizations can free up valuable resources, such as time and personnel, and redirect them towards more value-adding activities. This, in turn, can lead to faster project completion, higher customer satisfaction, and improved financial performance.
Moreover, cycle time analysis can help organizations make more informed decisions about resource allocation, task prioritization, and process improvements. By understanding the time it takes to complete various tasks, managers can make data-driven decisions about where to allocate resources, which projects to prioritize, and how to streamline their workflows. This level of visibility and control can be a game-changer in today's competitive business landscape.

Identifying Bottlenecks: The Path to Optimization
Unfortunately, the path to achieving optimal cycle time isn't always smooth sailing. Several roadblocks can impede progress and lead to inefficiencies. Here are some common culprits:
- Unclear requirements: Ambiguous or poorly defined requirements can lead to developers spending excessive time clarifying needs before they can begin coding.
- Inefficient code review processes: Lengthy review cycles or a lack of dedicated review time can significantly slow down development.
- Integration bottlenecks: Complex integration processes or merge conflicts can create delays in merging approved code.
- Inadequate testing procedures: Insufficient or poorly designed testing procedures can lead to regressions and rework, extending cycle time.
Strategies for reducing cycle time in JIRA
Reducing cycle time is a critical goal for organizations that want to improve efficiency and productivity. By leveraging the capabilities of JIRA, teams can implement a range of strategies to streamline their workflows and drive down cycle times.
One effective strategy is to optimize the JIRA workflow itself. This may involve simplifying the number of workflow stages, automating certain transitions, or introducing new workflow steps to address bottlenecks. By streamlining the workflow, organizations can reduce the time spent on administrative tasks and ensure that issues move through the process more efficiently.
Another strategy is to enhance collaboration and communication within the JIRA ecosystem. By integrating JIRA with other tools, such as communication platforms or project management software, teams can improve information sharing, reduce delays, and foster a more collaborative work environment. This can lead to faster issue resolution, quicker decision-making, and ultimately, reduced cycle times.
Additionally, organizations can leverage JIRA's reporting and analytics capabilities to identify areas for improvement. By analyzing cycle time data, teams can pinpoint the root causes of delays, such as resource constraints or inefficient task assignment. Armed with this information, they can then implement targeted interventions, such as adjusting resource allocation or implementing new task prioritization strategies, to drive down cycle times.
Best practices for utilizing JIRA cycle time effectively
To ensure that organizations can fully leverage the power of JIRA cycle time, it's essential to adopt a set of best practices that can guide their implementation and utilization efforts.
- Define clear workflow stages: Clearly define the key stages of your workflow, from initial request to final completion, to ensure accurate cycle time measurements. This will provide a solid foundation for your data analysis and process improvement efforts.
- Establish baseline metrics: Before implementing any changes, establish a baseline for your current cycle time metrics. This will allow you to measure the impact of your interventions and track progress over time.
- Involve cross-functional teams: Engage stakeholders from different departments, such as project management, development, and operations, to ensure that your cycle time analysis and improvement strategies address the needs of the entire organization.
- Automate data collection: Leverage JIRA's built-in reporting and analytics capabilities, as well as any relevant plugins or integrations, to automate the process of data collection and analysis. This will save time and ensure the accuracy of your cycle time data.
- Regularly review and iterate: Continuously monitor your cycle time data, identify areas for improvement, and implement changes to your workflows. Regularly review the impact of these changes and be prepared to adjust your strategies as needed.
- Communicate and collaborate: Foster a culture of transparency and collaboration by sharing cycle time data and insights with your team. Encourage open discussions and solicit feedback to drive continuous improvement.
- Align with organizational goals: Ensure that your cycle time optimization efforts are aligned with the overall strategic objectives of your organization. This will help you prioritize your initiatives and demonstrate the business impact of your efforts.
By adopting these best practices, organizations can unlock the full potential of JIRA cycle time and drive sustainable improvements in efficiency and productivity acrosstheir operations.
How to Measure Cycle Time in JIRA with Keypup
JIRA provides a powerful platform for measuring and analyzing cycle time. When paired with Keypup, you gain a more insightful picture:
- JIRA's Built-in Capabilities: JIRA offers features to define workflow stages and utilize reporting tools to track cycle time data. Keypup seamlessly integrates with JIRA, allowing you to leverage this existing functionality.
- Keypup's Advanced Insights: Keypup goes beyond basic cycle time tracking! Its Cycle Time Dashboard and Reports provide real-time visualizations and in-depth breakdowns, empowering you to make data-driven decisions for process improvement.
Analyzing the cycle time data collected in JIRA and visualized by Keypup is a crucial step in driving process improvement and enhancing organizational efficiency. By delving into the insights, teams can uncover valuable information about their workflows and identify areas that require attention.
Beyond the best practices outlined above, connecting JIRA to your Keypup platform can significantly enhance your cycle time tracking and analysis capabilities. Keypup's real-time dashboards, granular breakdown reports, and targeted metrics provide an unparalleled level of visibility and control over your workflows.
This will allow you to:
- Make data-driven decisions with real-time insights
- Identify and address bottlenecks proactively
- Optimize resource allocation for maximum efficiency
- Streamline processes and eliminate waste
- Accelerate project delivery and enhance customer satisfaction
Here's how Keypup empowers you to gain deeper visibility and optimize your development workflow:
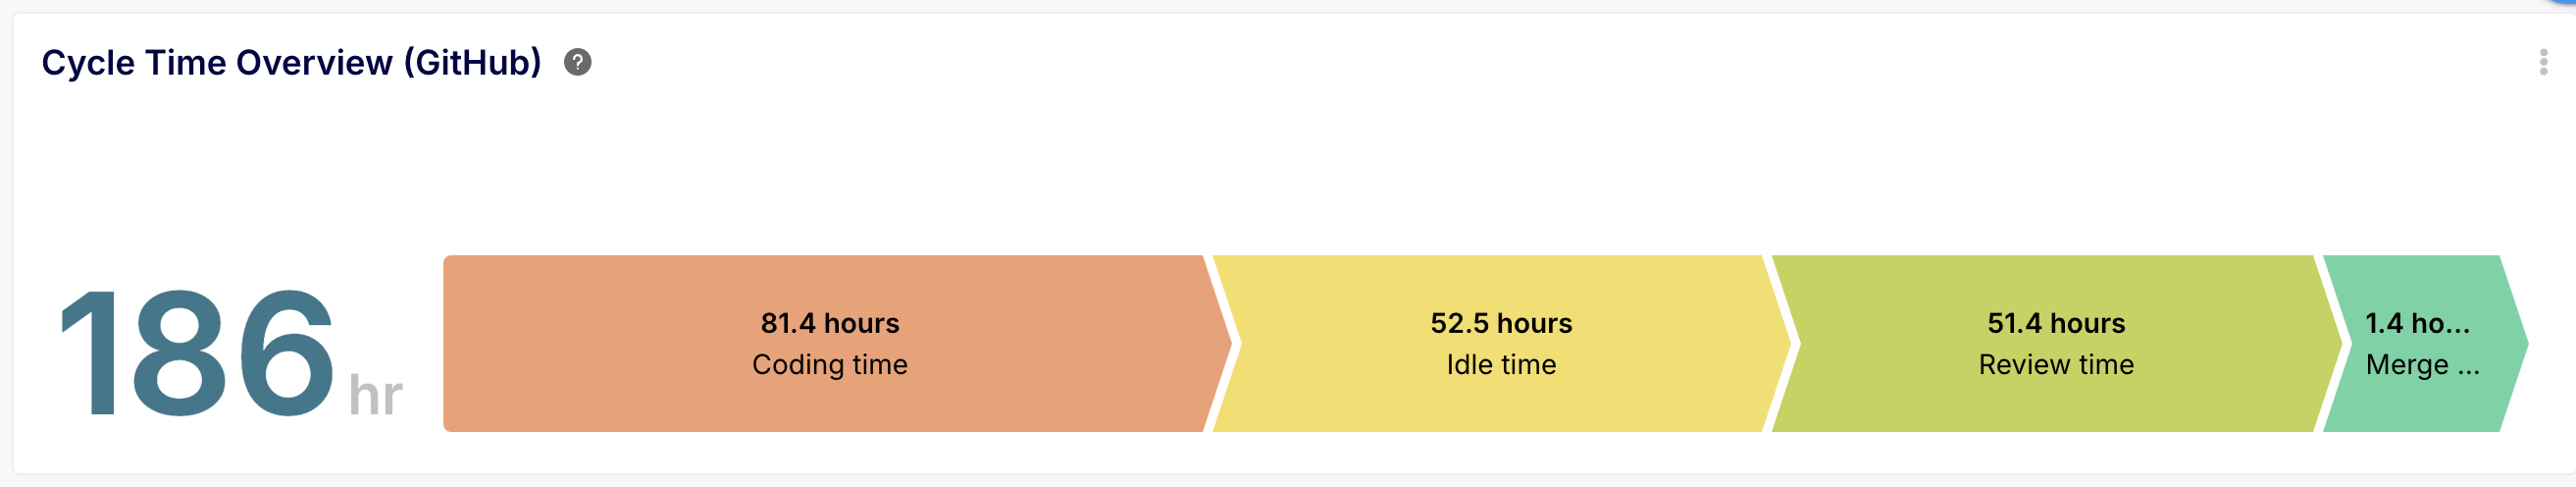
- Cycle Time Overview Metric: Gain a comprehensive understanding of the average time it takes for issues to traverse your entire workflow. This metric provides a valuable benchmark for evaluating your team's overall efficiency and identifying areas for improvement.
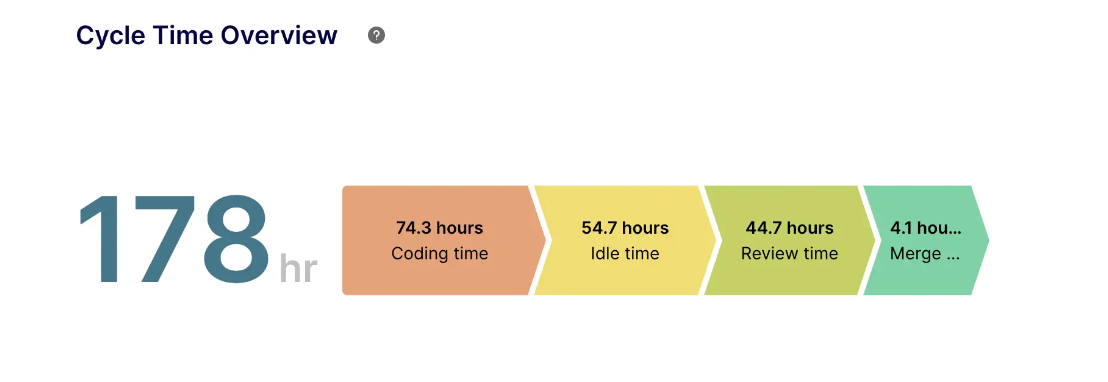
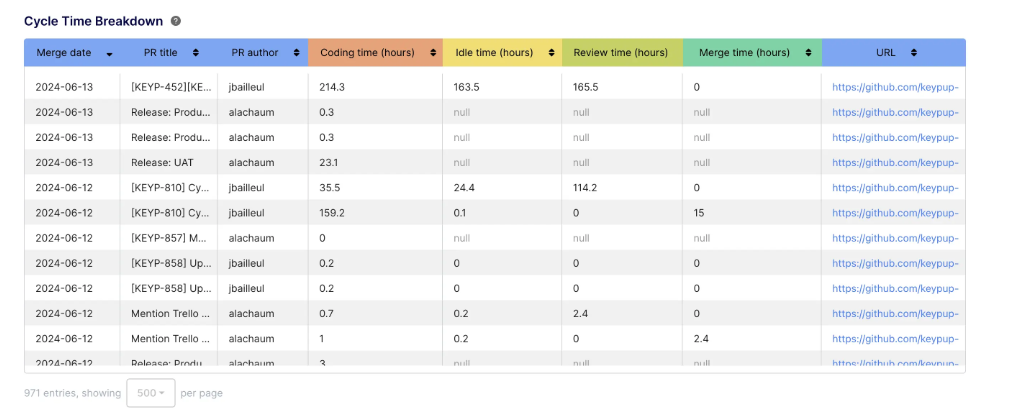
- Cycle Time Breakdown Report: Dive deeper and pinpoint exactly where time is being spent within your development process. Keypup's breakdown report breaks down cycle time into its constituent stages, such as coding, review, and merge time. This granular visibility allows you to identify bottlenecks and target specific areas for optimization.
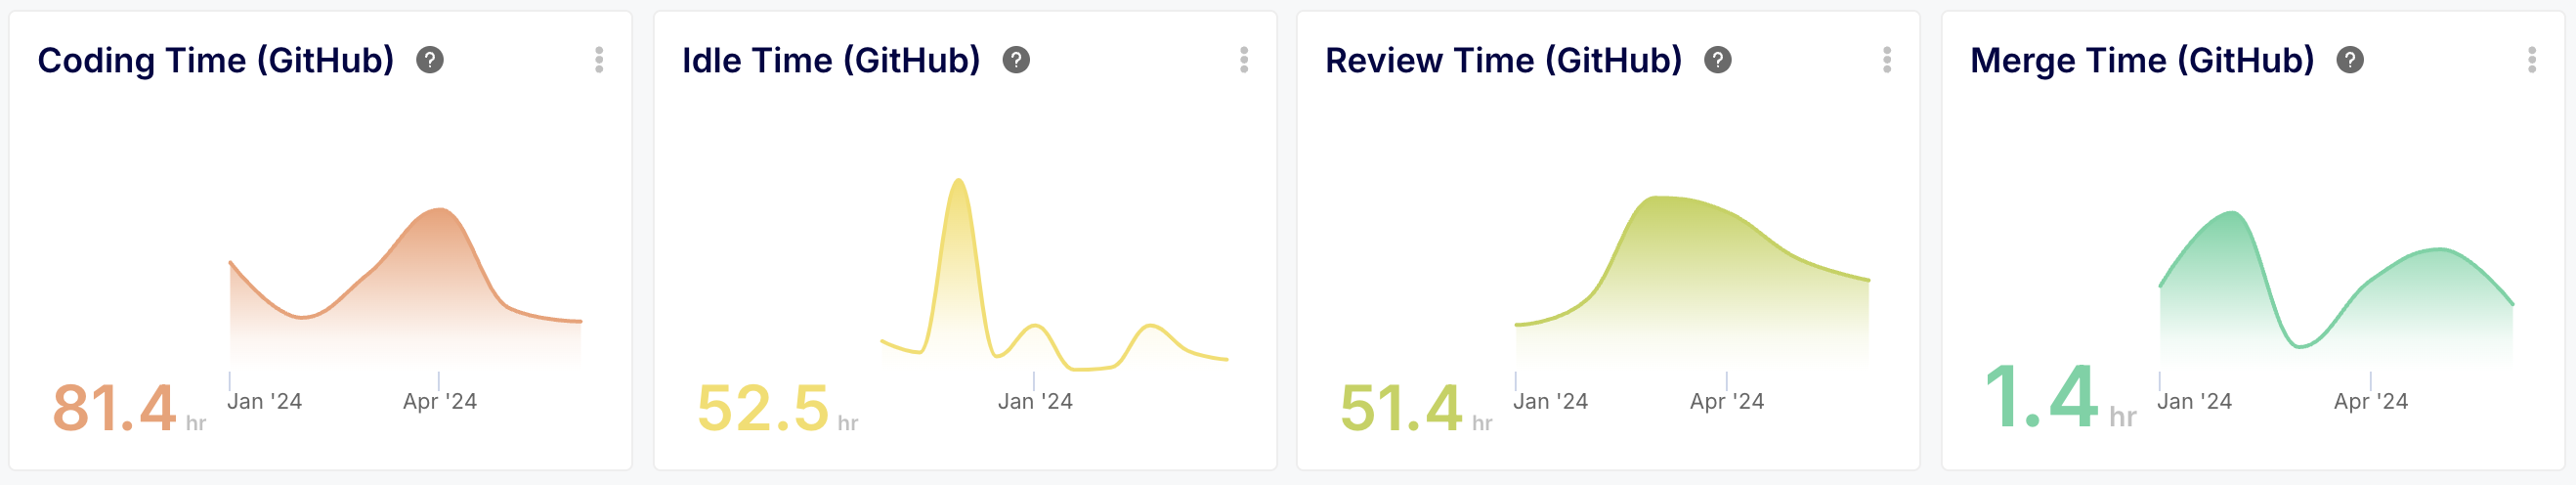
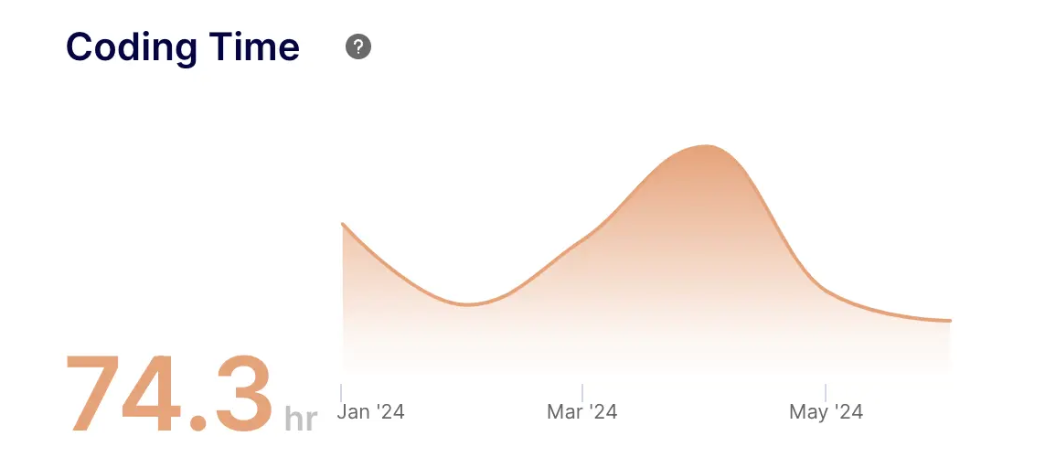
- Coding Time Metric: Is coding velocity hindering your progress? Keypup's coding time metric sheds light on the average time developers spend coding on issues. By analyzing this metric, you can assess developer productivity and identify opportunities for streamlining the coding process.
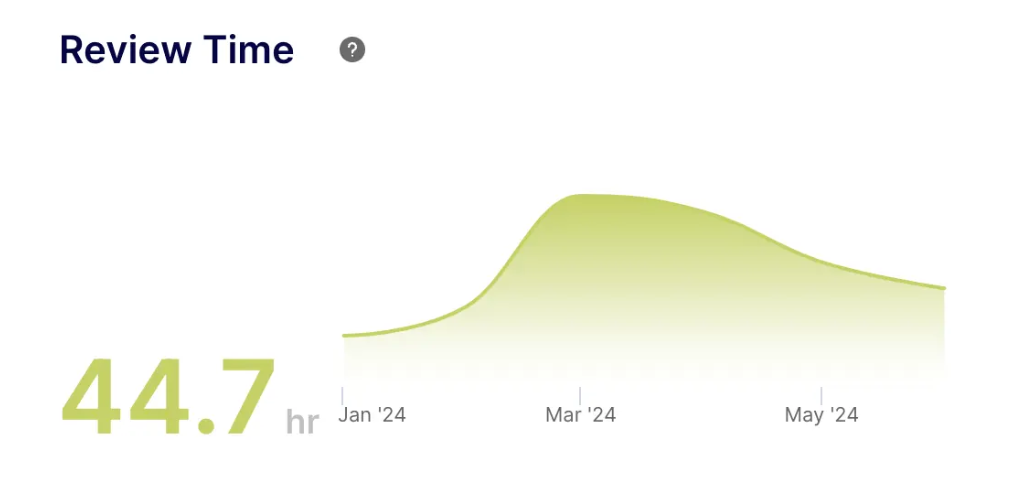
- Review Time Metric: Streamlining the code review process is paramount for efficient development. Keypup's review time metric exposes the average time it takes for reviews to be completed. This metric empowers you to optimize the review process by pinpointing areas for improvement, such as reducing pull request size or assigning dedicated review time.
- Merge Time Metric: How long does it take for approved pull requests to be merged? Keypup's merge time metric brings transparency to this critical stage of the development lifecycle. By tracking this metric, you can identify inefficiencies in the merging process and ensure timely integration of approved code.
Conclusion: Unlocking the full potential of JIRA Cycle Time for your organization** **
In today's fast-paced business environment, the ability to efficiently manage and complete projects is a crucial competitive advantage. JIRA Cycle Time, coupled with Keypup's powerful dedicated dashboards and metrics, offers an unparalleled opportunity to unlock this potential, driving significant improvements in efficiency and productivity.
By understanding the concept of cycle time, measuring and analyzing the time it takes for tasks to move through the workflow, and implementing targeted strategies to reduce cycle times, organizations can achieve remarkable results. From identifying and addressing bottlenecks to enhancing cross-functional collaboration and resource allocation, JIRA Cycle Time, empowered by Keypup, provides the insights and capabilities needed to optimize processes and deliver projects more quickly.
The case studies presented in this article demonstrate the real-world impact of leveraging JIRA Cycle Time, with organizations across industries experiencing significant reductions in cycle time and corresponding boosts in productivity and customer satisfaction. By adopting the best practices outlined and leveraging Keypup's solutions, organizations can further enhance their JIRACycle Time capabilities and unlock even greater benefits.
As you embark on your journey to improve efficiency and productivity, consider the power of JIRA Cycle Time as a transformative solution. By harnessing the insights and capabilities it provides, empowered by Keypup's suite of solutions, you can drive continuous improvement, foster a culture of data-driven decision-making, and position your organization for long-term success in today's competitive landscape.


