In the ever-evolving landscape of software development, the ability to track progress and understand the dynamics of your projects is not just an advantage—it's a necessity. Enter GitHub Analytics, a powerhouse of insights that turns data from your repositories into actionable intelligence. Whether you're a solo developer or part of a sprawling team, these analytics offer a window into the heartbeat of your projects, revealing patterns and trends that might otherwise go unnoticed.
But why is GitHub Analytics so crucial? Simply put, it's about making informed decisions. With it, you can monitor everything from how often contributors are participating in your projects, to how effectively your team is collaborating. This data isn't just numbers; it's a narrative of your software project's performance and progress.
In this comprehensive guide, "GitHub Analytics 101," we're going to delve into the nuts and bolts of GitHub Analytics. From identifying the fundamental metrics that matter to leveraging this data for better project management, we'll cover all the bases. We’ll also touch upon advanced tools and best practices that can help you fine-tune your development process, and ultimately, drive your projects forward.
But before we dive into the technicalities, imagine being able to spot and solve bottlenecks before they become a bigger issue, or fast-forward your software delivery. That's the power of GitHub Analytics at your fingertips—it's not just about managing your projects; it's about leading them to new heights of success.
Stay tuned as we unfold the layers of GitHub Analytics and provide you with the knowledge to not only understand your repositories' pulse but to also control the rhythm effectively.
What Is GitHub Analytics?
GitHub Analytics is a suite of metrics and tools designed to provide tech leaders and developers with insight into their code repositories hosted on GitHub. At its core, GitHub Analytics helps users understand how their projects are progressing, and it measures the activity within the repositories to facilitate better project management.
Definition and Components of GitHub Analytics
At its simplest, GitHub Analytics can be broken down into three key components:
- Pulse and contribution: Pulse and contribution gives a summary of the activity in one or multiple repos over a period of time, including (but not limited to) completed PRs, the Project Effort Distribution, and Engineering Work Pattern Analysis, offering a snapshot of project health.
- Overall software team performance: Overall software team performance helps you identify and solve cycle time bottlenecks, ensuring your team achieves elite performance. DORA metrics and the Cycle Time dashboard are the most widely used metrics in this area.
While there are many analytics tools available, GitHub Analytics is unique due to its integration with GitHub’s ecosystem. Unlike general analytics platforms, GitHub Analytics is tailored specifically for development projects hosted on GitHub. It provides insights into the collaborative aspects of software development, such as contributions to source code, issue tracking, and the management of commits, reviews, and pull requests.
Other tools might offer broader analytics or insights into user behavior on a deployed application, whereas GitHub Analytics is more about the health and activity of the development process itself.
The Role of GitHub Analytics in Project Management and Development
Analytics play a pivotal role in project management and development, particularly in the following areas:
- Performance monitoring: By tracking how and when code is being contributed, tech leads can monitor a team’s performance and ensure that the projects are on track.
- Resource allocation: Understanding which parts of a project are most active can help in allocating resources effectively, ensuring that effort is directed where it's most needed.
- Quality assurance: Analytics can help identify patterns that may indicate issues with code quality or workflow problems, such as recurring bugs in certain parts of the project.
- Strategic planning: By providing a historical view of project activity, analytics can inform future project roadmaps and help predict how changes might impact project timelines and workload.
In essence, GitHub Analytics bridges the gap between the raw code and the human elements of project development. It offers a quantitative perspective on the collaborative efforts that go into building software, enabling teams to streamline workflows, enhance productivity, and make informed decisions that steer projects toward successful outcomes.
Getting Started with GitHub Analytics
Dive into the world of analytics with Keypup’s GitHub Analytics tool, a versatile SaaS solution designed to amplify your GitHub experience. Keypup stands out as a premier GitHub analytics tool that adapts to the complex needs of any project, from nimble startups to sprawling enterprises. This section walks you through the essentials of accessing and navigating Keypup's GitHub Analytics to harness its full power for your software development lifecycle.
How to Access Keypup's GitHub Analytics
- Connect your GitHub account: Start by visiting this page. Click on the "Connect Your GitHub Now" button to begin the integration process.
- GitHub single sign-on (SSO): Take advantage of the seamless GitHub SSO sign-up/login feature, which allows you to quickly onboard your team using GitHub credentials. Alternatively, you can connect using any SSO alternative or by using your email address and creating a password.
- Custom dashboard creation: Once logged in, Keypup's configuration assistant can help you set up a custom dashboard by simply answering a few questions to reflect your project's specific needs.
Navigating Keypup’s GitHub Analytics Interface
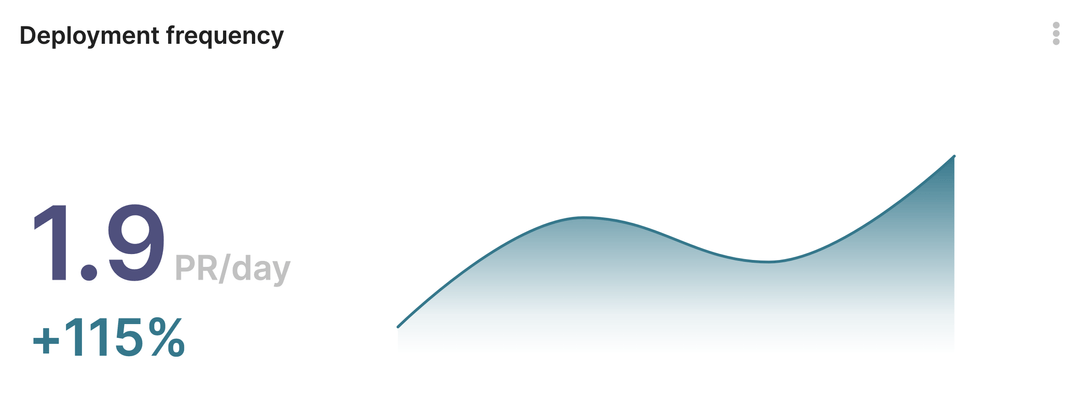
- Real-time dashboards: Immediately upon login, you'll be greeted by real-time customizable dashboards that provide comprehensive metrics and insightful reports. You can monitor key performance indicators (KPIs) like Deployment Frequency, Change Failure Rate, and much more.
- Insight and dashboard filtering: Use Keypup's intelligent filtering to sift through data and focus on the metrics that are most pertinent to your objectives. This feature allows you to make data-driven decisions quickly and efficiently.
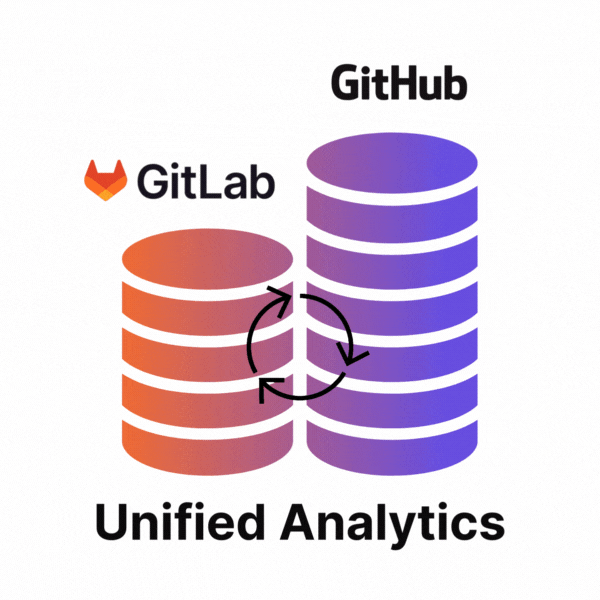
- Multi-repository monitoring: For those juggling multiple projects, Keypup enables the monitoring of various Git repositories, ensuring a unified view of your development activity across platforms like GitHub, GitLab, and Bitbucket.
Initial GitHub Analytics Configuration for Optimal Use
- Select and adapt dashboard templates: Keypup offers a library of over 40 engineering metrics and KPIs. Navigate through dashboard and insight templates and select those that resonate with your workflow. Customize them to your project's naming conventions or utilize Keypup's assisted configuration for a swift setup.
- Data environment customization: Build your own insights and dashboards by accessing datasets from your Git repositories. Aggregate data from pull requests, issues, commits, and reviews to create tailored reports.
- Collaboration features: Share and collaborate on your GitHub analytics dashboards with your engineering team. Keypup’s sharing capabilities encourage a data-driven culture and come with unlimited user access, promoting widespread adoption and collaboration.
With Keypup's GitHub Analytics tool, you’re not just accessing data; you’re empowering your team with the knowledge to identify bottlenecks, accelerate delivery, and scale your GitHub operations effectively. All templates are fully customizable, ensuring that as your organization grows and evolves, your analytics can too.
Begin Your Journey with GitHub Analytics
Whether your goal is to improve software delivery, manage technical debt, or streamline processes, the journey begins with measuring the right metrics. Keypup doesn’t force you to adapt to its system; it evolves with you, providing a flexible, data-driven foundation for your GitHub projects. Start building your tailored GitHub Analytics ecosystem with Keypup today and unlock the potential of your engineering endeavors.
Key Metrics in GitHub Analytics
Navigating the complexity of software development requires a robust set of metrics to ensure efficiency, quality, and compliance. Keypup's GitHub Analytics tool provides a suite of insightful metrics that serve as a compass for software development teams. The following details how each of these metrics can shape the success of your development processes.
Software Development Cycle Time Metrics
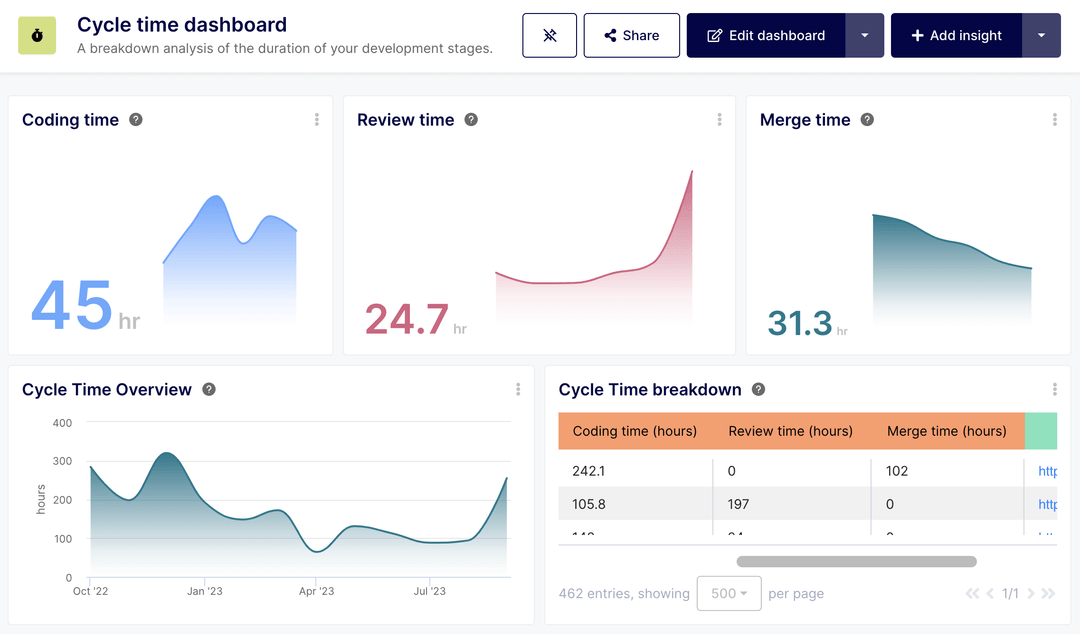
Cycle Time metrics provide critical insights into the efficiency and effectiveness of your software delivery process. By measuring the duration of each stage in the software development lifecycle, these metrics help you identify and address delays to improve overall productivity.
- Coding Time: Tracks the period from when work begins on new code to when it's ready for review, spotlighting the efficiency of initial development efforts.
- Review Time: Measures the time taken for peer review, providing a gauge of your collaborative processes and the speed of your feedback cycles.
- Merge Time: Monitors the time from code review completion to its integration into the main branch, reflecting the efficiency of your final approval and merge processes.
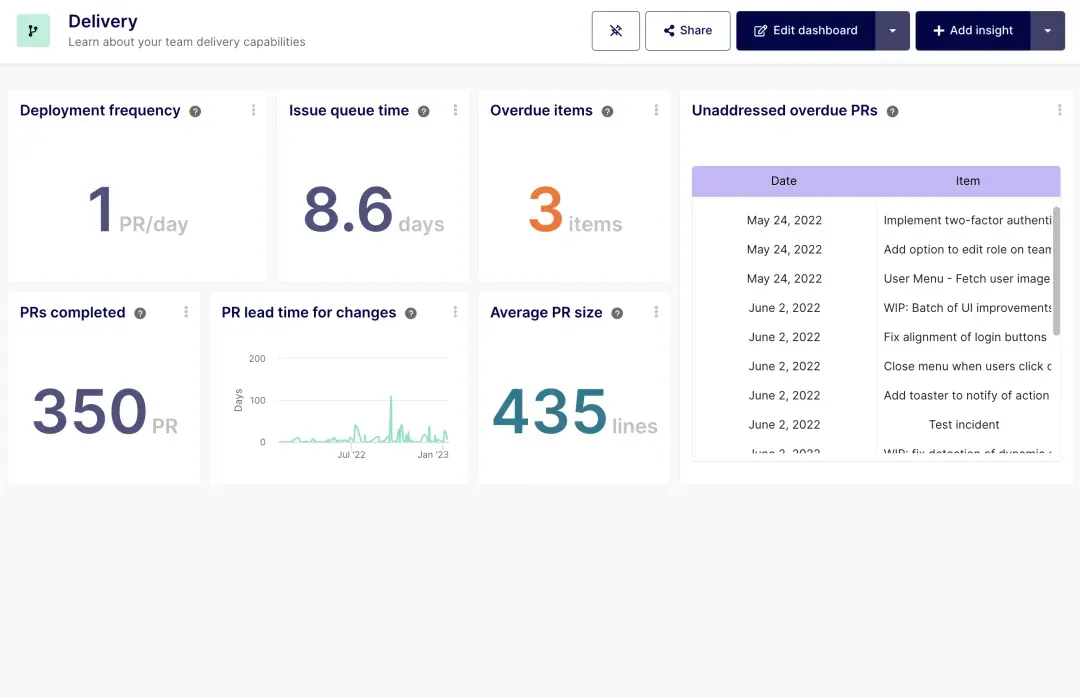
Software Speed of Delivery Metrics
In the quest for agility, Speed of Delivery metrics assess how quickly and effectively your team delivers quality software.
- Average Pull Request Size: By tracking the average size of merged pull requests, this metric encourages smaller, more manageable chunks of work, facilitating quicker reviews and deployments.
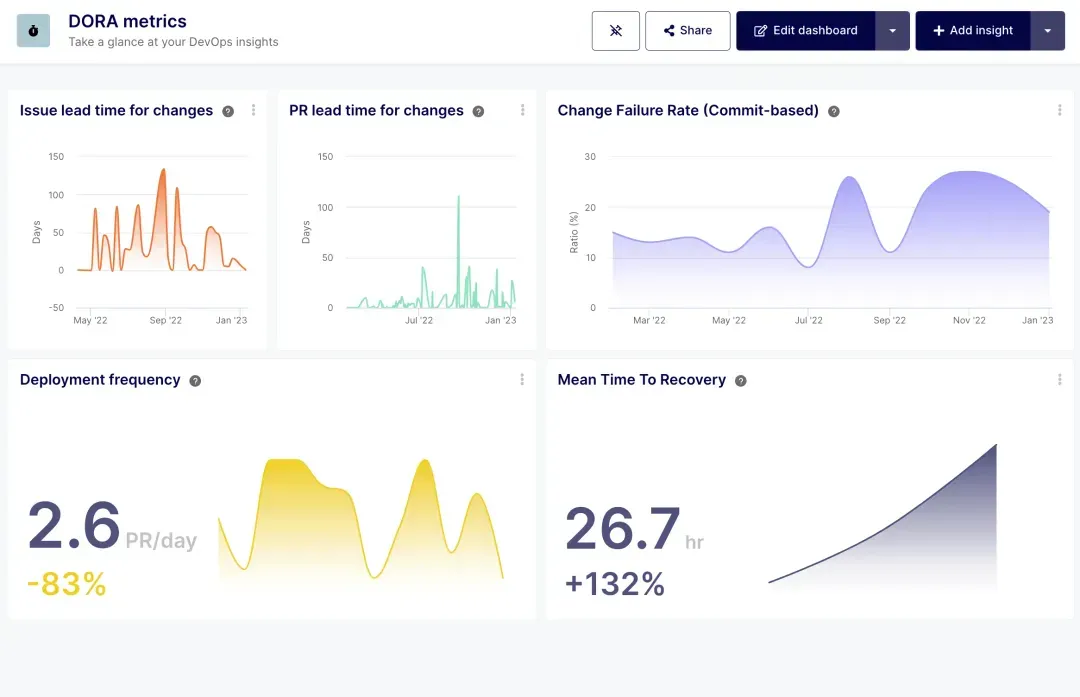
- DORA Metrics: This set of four key metrics—change failure rate, deployment frequency, lead time for changes, and mean time to recovery—provides a holistic view of your DevOps health and performance.
- Issue Queue Time: Calculates the time issues spend waiting to be picked up from the backlog, shedding light on process bottlenecks.
- Overdue Items: Counts items past their expected completion date, offering insights into potential issues with planning or team capacity.
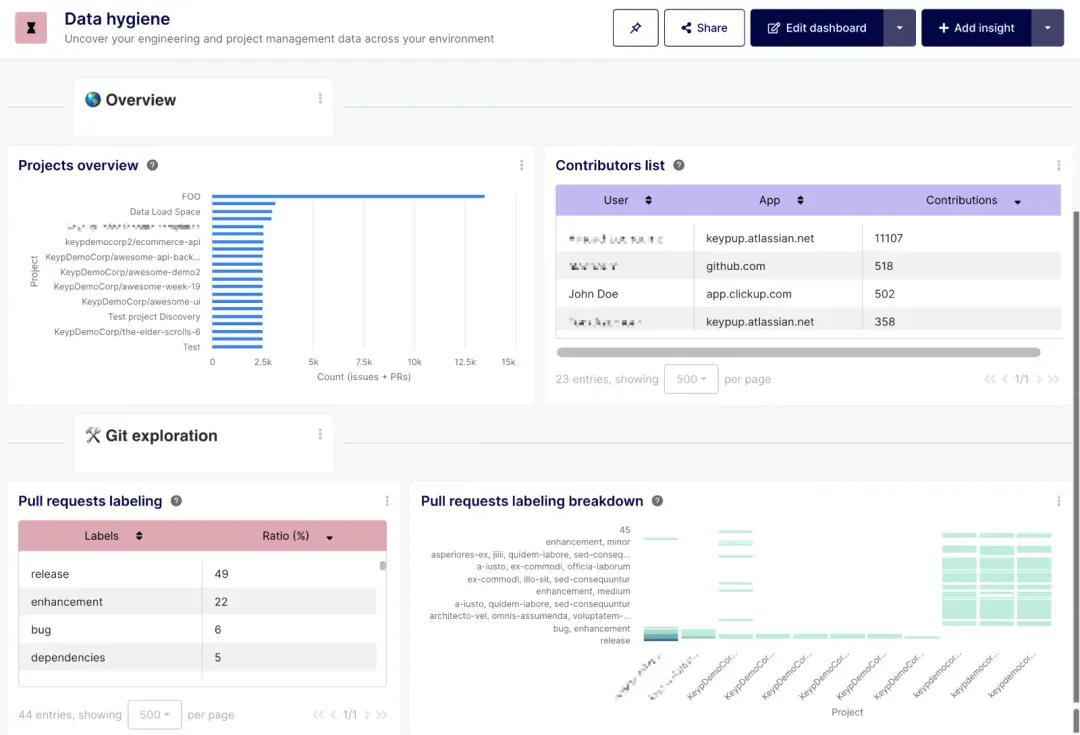
Software Data Hygiene and Process Metrics
Data Hygiene and Process metrics are vital for maintaining clean, consistent, and actionable data within your engineering processes.
- Pull Request Labels Usage: This metric examines how consistently and effectively your team uses labels in pull requests, which can improve organization and tracking.
- Commit Keywords Usage: Analyzes the frequency and context of keywords in commit messages, aiding in quicker issue resolution and better historical tracking.
- Scoped Issues Ratio: Evaluates the percentage of issues that have been properly scoped with descriptions, improving clarity and reducing miscommunication within the team.
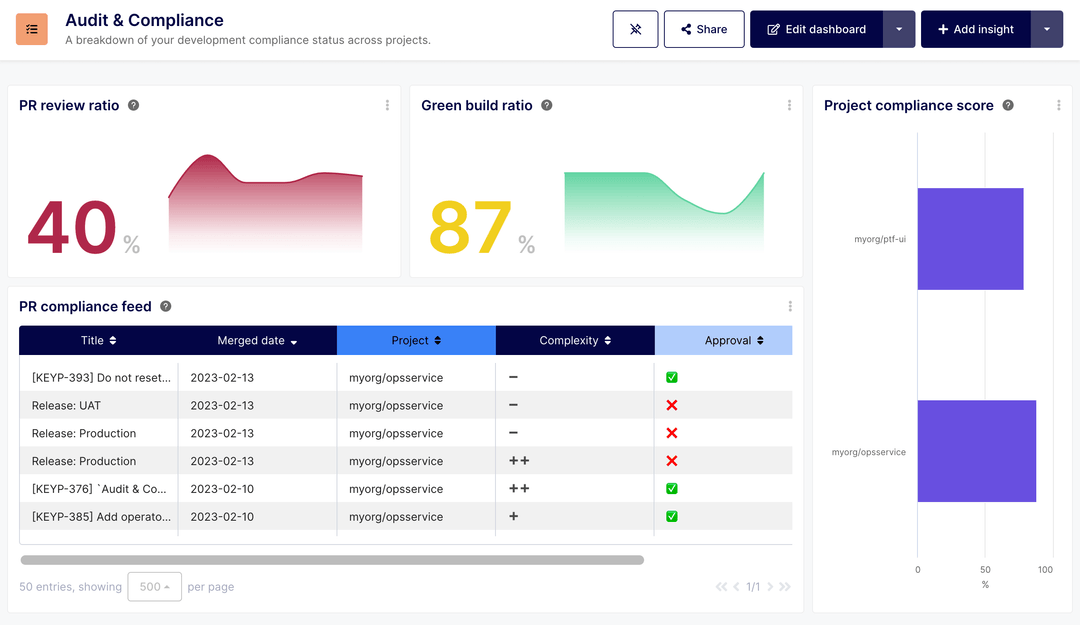
Software Process Quality and Compliance Metrics
Process Quality and Compliance metrics are key to understanding and improving the quality of your codebase and ensuring that your development practices meet industry standards.
- Average Pull Request (PR) Size: Reflects the typical scope of work within PRs, with smaller sizes generally indicating more focused and manageable updates.
- Bug Lead Time for Changes (BLTC): Tracks how quickly your team responds to and resolves bugs, an essential factor in maintaining a high-quality codebase.
- Raised Bugs Tracker (RBT): Keeps a count of identified bugs over time, providing insights into the quality trend of your product.
- Pull Request Review Ratio (PRRR): Ensures that PRs have gone through the necessary peer review process, which is critical for maintaining code quality and meeting compliance standards like SOC 2.
Effective utilization of GitHub Analytics can significantly enhance project management and team performance in software development. Here are some best practices for leveraging these analytics tools.
Regular Checks and Updates Based on GitHub Analytics
- Scheduled analytics reviews: Incorporate regular and systematic reviews of analytics into the team’s routine. This could be a weekly analysis of key performance indicators (KPIs) to ensure that the team's performance aligns with project goals.
- Adaptive planning: Use the insights gained from GitHub Analytics to inform sprint planning and backlog grooming sessions. If certain types of issues are taking longer to close, for instance, investigate and adapt the workflow or resources accordingly.
- Continuous integration and deployment (CI/CD) monitoring: Leverage analytics to monitor the success and frequency of CI/CD processes. Tracking deployment frequency and change failure rates can help identify potential areas for process improvement.
Encourage Team Engagement with GitHub Analytics
- Democratize data access: Make analytics accessible to all team members, not just managers or leads. When team members can view the impact of their work on the overall project, it can boost motivation and accountability.
- Analytics education: Educate team members on how to interpret analytics dashboards and reports. Understanding what metrics like cycle time or merge time mean in practical terms can help them contribute to process improvements.
- Recognition and reward: Use analytics as a tool for recognizing and rewarding team members. Celebrate when milestones are achieved or when there is noticeable improvement in the metrics, such as a reduction in issue resolution time.
Case Studies of Effective Use of Git Analytics
The real-world application of Git Analytics can be best understood through case studies that illustrate the transformative impact on software development teams. Here are two such examples.
Case Study 1: Enhancing Operational Excellence with Git Analytics
Dayrize, a leading sustainability assessment firm, faced challenges in aligning goals and tracking progress due to a manual and time-consuming development process. The introduction of an advanced Git Analytics tool allowed them to:
- Integrate different systems such as Jira and Bitbucket, enabling efficient monitoring of DevOps metrics.
- Adopt a data-driven approach, improving accountability and enabling the effective measurement and communication of engineering key performance indicators (KPIs) and service-level agreements (SLAs).
- Utilize a DORA Metrics dashboard to monitor and improve DevOps performance, significantly optimizing operational excellence.
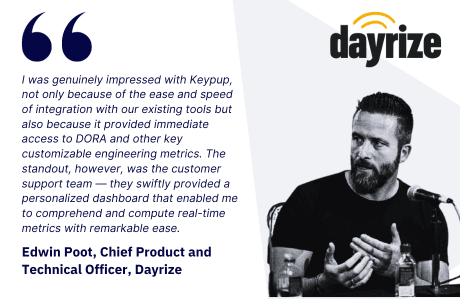
Edwin Poot, chief product and technical officer, highlighted the ease and speed of integration with their existing tools and the immediate access to customizable engineering metrics as pivotal in transforming their operational processes.
Case Study 2: From Monitoring to Mastery in Digital Therapeutics
Kaia Health, a digital therapeutics company, was grappling with longer than desired pull request cycle times, which was hampering their development rhythm. By leveraging a Git Analytics tool, they were able to:
- Achieve transparency in identifying bottlenecks within the development lifecycle.
- Empower every team member, from engineers to product managers, to self-monitor their metrics and identify areas for improvement.
- Plan to integrate additional tools like Jira for a more comprehensive view of their processes and further customize dashboard templates.
Senior Android Developer Tassilo Posegga commended the tool for providing a clear perspective on the team's functionality and progress, as well as the outstanding customer support that contributed to a positive overall experience.
These case studies demonstrate the power of Git Analytics in providing teams with the insights needed to streamline their processes, improve transparency, and empower team members to take charge of their contributions to the project's success.
Unlocking the Potential of Your Software Projects with GitHub Analytics
In conclusion, GitHub Analytics is not just a feature; it's a catalyst for transformation within the software development lifecycle. By leveraging the rich insights provided by tools like Keypup, teams are not only able to diagnose and predict their project's trajectory but also enhance their operational excellence, streamline their development processes, and foster a culture of continuous improvement and collaboration.
The case studies we explored underscore the remarkable potential of GitHub Analytics to revolutionize project management. They provide a blueprint for other organizations looking to harness the power of their data to drive better decisions, deliver quality software faster, and maintain a competitive edge in the ever-accelerating tech landscape.
As we have seen, the effective use of GitHub Analytics goes beyond monitoring—it's about actively engaging with the data to forge a path towards mastery of your software development processes. It is about creating an environment where every team member is empowered with the knowledge to contribute meaningfully to the project's success.
So, as you stand at the threshold of this vast repository of data, remember that each metric and insight is a stepping stone toward optimizing your team's performance. With GitHub Analytics, you have the power to not only understand but also shape the pulse of your projects. Take this knowledge, apply these best practices, and embark on a journey that leads your projects to their fullest potential.
GitHub Analytics FAQ

What is GitHub Analytics?
GitHub Analytics is a set of tools and metrics that provide insights into the activity and performance of repositories hosted on GitHub. It helps teams understand progress, monitor collaboration, and improve project management through actionable data.
How do GitHub Analytics help in project management?
GitHub Analytics aids in project management by offering data on team performance, resource allocation, and project progress. It helps in identifying bottlenecks, ensuring code quality, and informing strategic planning based on historical and real-time data.
Can GitHub Analytics be customized for different project needs?
Yes, GitHub Analytics can be customized to fit various project needs. Tools like Keypup allow you to create custom dashboards, select or create relevant metrics, and tailor the analytics environment to align with your project's specific requirements.
What are some of the key metrics available in GitHub Analytics?
Key metrics in GitHub Analytics include Development Cycle Time metrics (like Coding Time, Review Time, Merge Time), Speed of Delivery metrics (such as Pull Request Size and DORA metrics), and Process Quality metrics (like Pull Request Labels Usage and Commit Keywords Usage).
Is it possible to track multiple repositories with GitHub Analytics?
Yes, GitHub Analytics tools like Keypup enable the monitoring of multiple repositories across platforms like GitHub, GitLab, and Bitbucket, offering a consolidated view of your development activity.
How often should a team review their GitHub Analytics?
Teams should conduct regular reviews of their GitHub Analytics, typically on a weekly basis, to keep track of key performance indicators and ensure alignment with project objectives.
Can all team members access GitHub Analytics?
Yes, it's recommended to democratize data access and allow all team members to view analytics. This transparency can enhance team engagement, accountability, and performance.
How do GitHub Analytics contribute to improving code quality?
GitHub Analytics can identify trends and patterns that may indicate issues with code quality, helping teams to address problems early on. Metrics such as Bug Lead Time for Changes and Raised Bugs Tracker are specifically useful for maintaining high code quality standards.
Are there any best practices for using GitHub Analytics to improve performance?
Best practices include conducting regular analytics reviews, adapting project plans based on insights, monitoring CI/CD processes, educating team members on data interpretation, and recognizing achievements based on analytics improvements.
Can GitHub Analytics be used to manage technical debt?
Absolutely, GitHub Analytics can help manage technical debt by tracking how changes affect the stability and performance of the software, thereby informing decisions on when and where to address technical debt.
How do case studies help in understanding the use of GitHub Analytics?
Case studies provide real-world examples of how teams utilize GitHub Analytics to overcome challenges, streamline processes, and enhance performance. They offer practical insights and successful strategies that can be adopted by other teams.


